ConCorDia permanent seismic station - CCD
For the past ten years, we have been working towards an observatory quality permanent seismic station at Concordia. Since 2005, and the start of over-wintering at the research station, the seismic station has been running all year round. The data quality has been continously improving, as we solve the various problems caused by running instruments at temperatures well below their operating range.
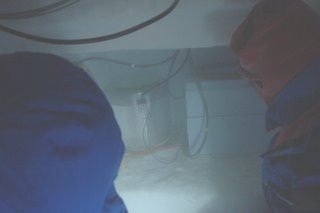
The seismic vault is 15 meters deep and 1 kilometer away from the base itself. Once at the shelter, one opens a trapdoor that leads down to a 45m horizontal snow tunnel. At the end of the tunnel is a short metal ladder, which leads to a longer metal ladder that takes one down to the vault itself. It is bitterly cold beyond the trapdoor, and it only gets worse the deeper into the vault one goes. The air is soon filled with mist from our breath, so visibility quickly becomes poor. The temperature within the seismic vault is a constant -59 degrees C, very stable but much lower than what is reasonable for any electromechanical instrument to be working at.
The permanent seismic station has been registered at the International Registry of Seismograph Stations under the code name CCD (ConCorDia). The station contains two STS-2 seismometers connected to two different acquisition systems, a Q4128 and a Q330. The seismometer connected to the Q4128 is heated to -25 degrees C and is the official source of data for CCD. All the files available from this page refer to the Q4128 data. Station details follow:
Code: CCD
Latitude: -75.10650
Longitude: 123.30500
Elevation: 3240m
Depth: 15m
Name: Concordia, Antarctica
Region: East Antarctica
Status: Open from 1 Jan 2007
Data quality at CCD are not yet of "observatory" quality, and are therefore not distributed through the usual data centers (e.g. IRIS). They are, however, freely available to interested parties. Please contact Jean-Jacques Leveque (leveque@sismo.u-strasbg.fr) for data requests. Also available through Jean-Jacques are plots and data for the unheated seismometer (Q330 data).
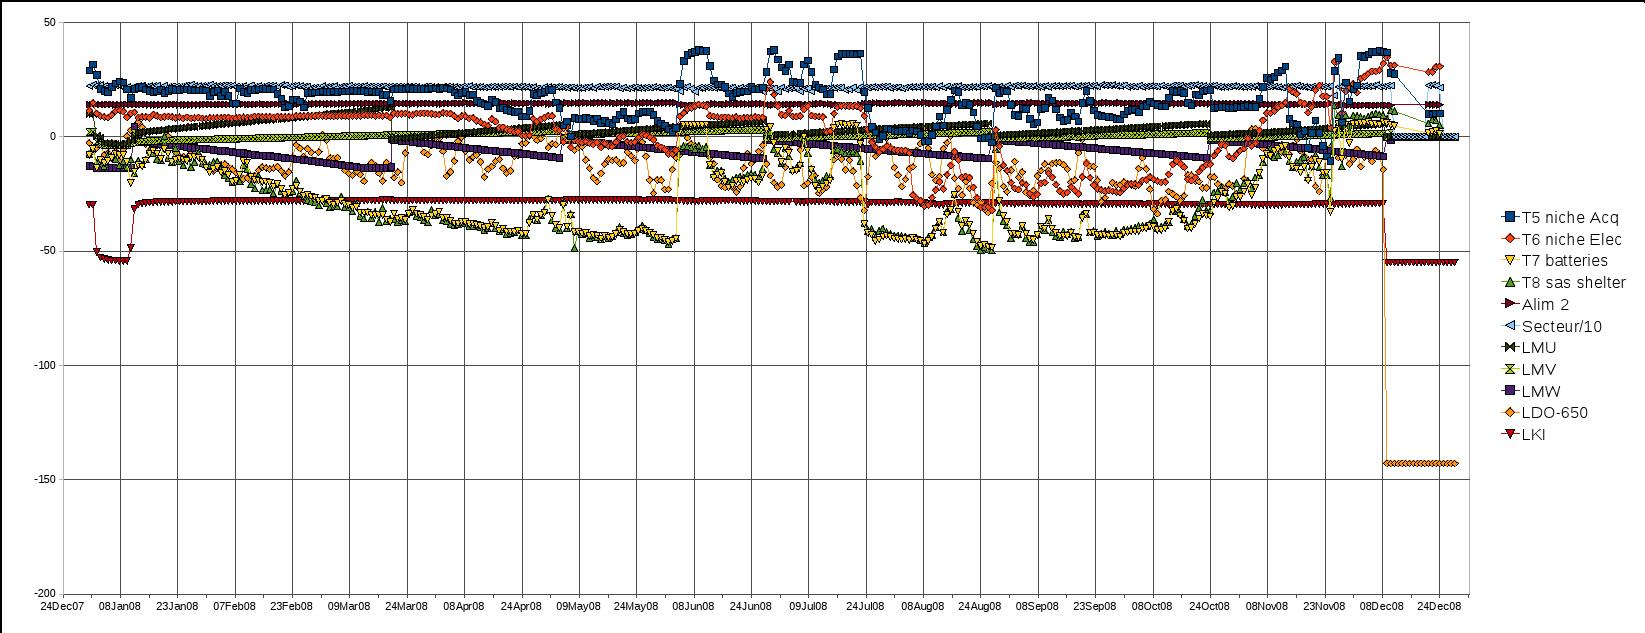
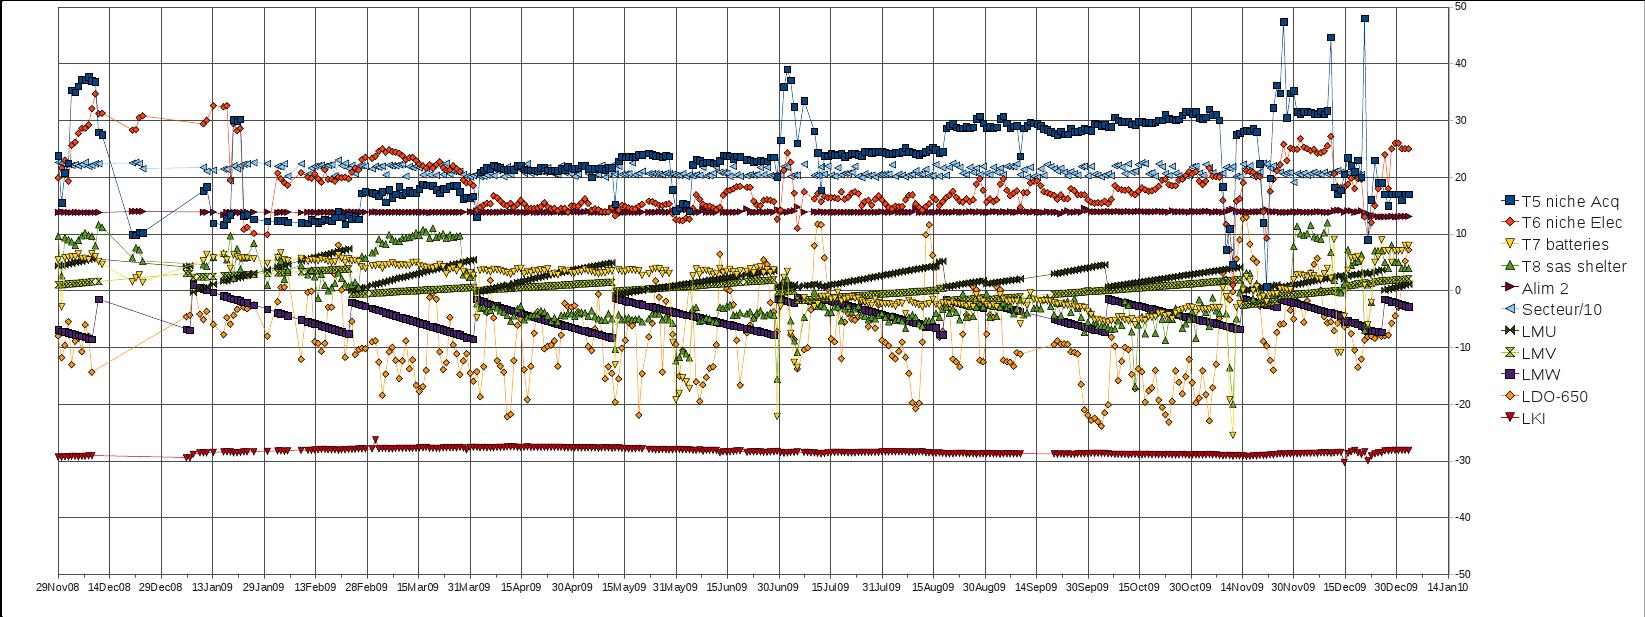
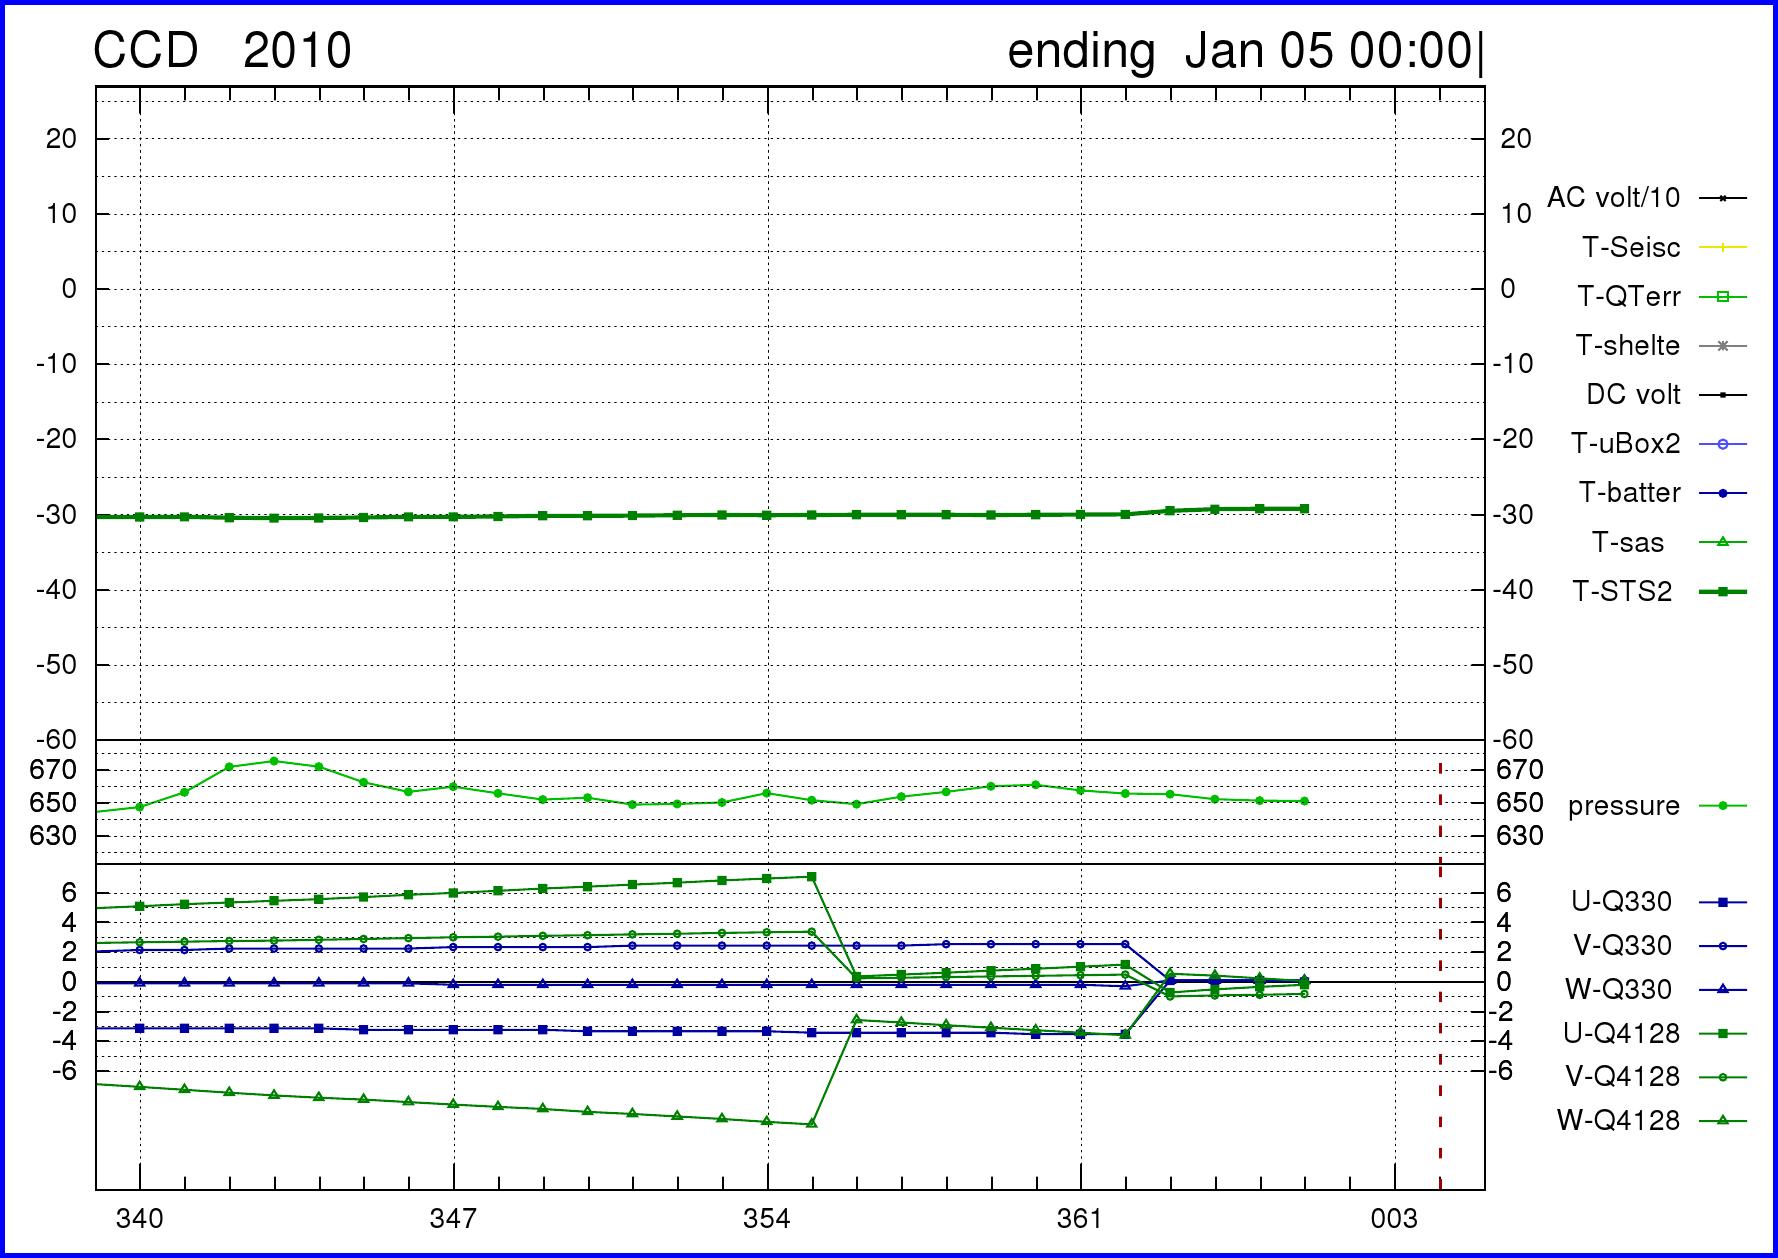
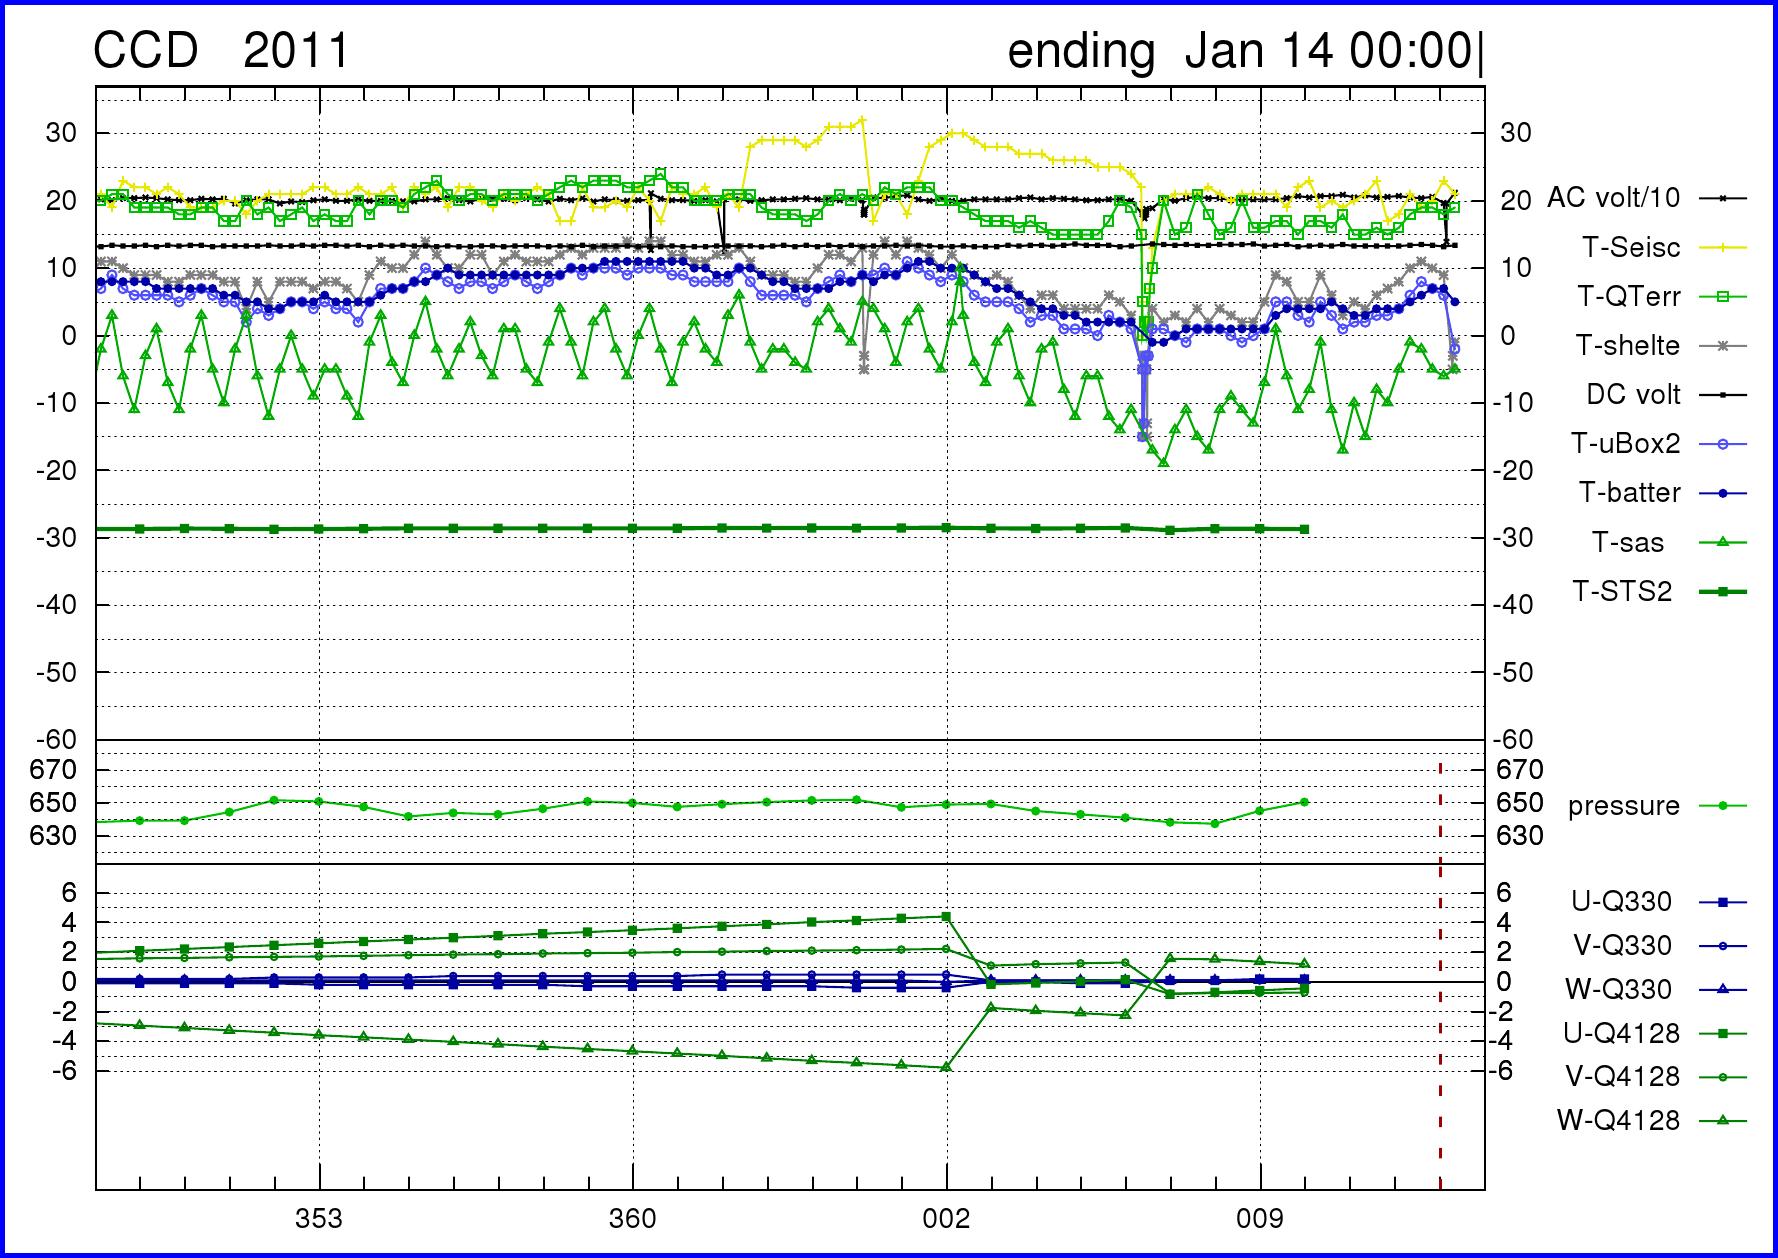
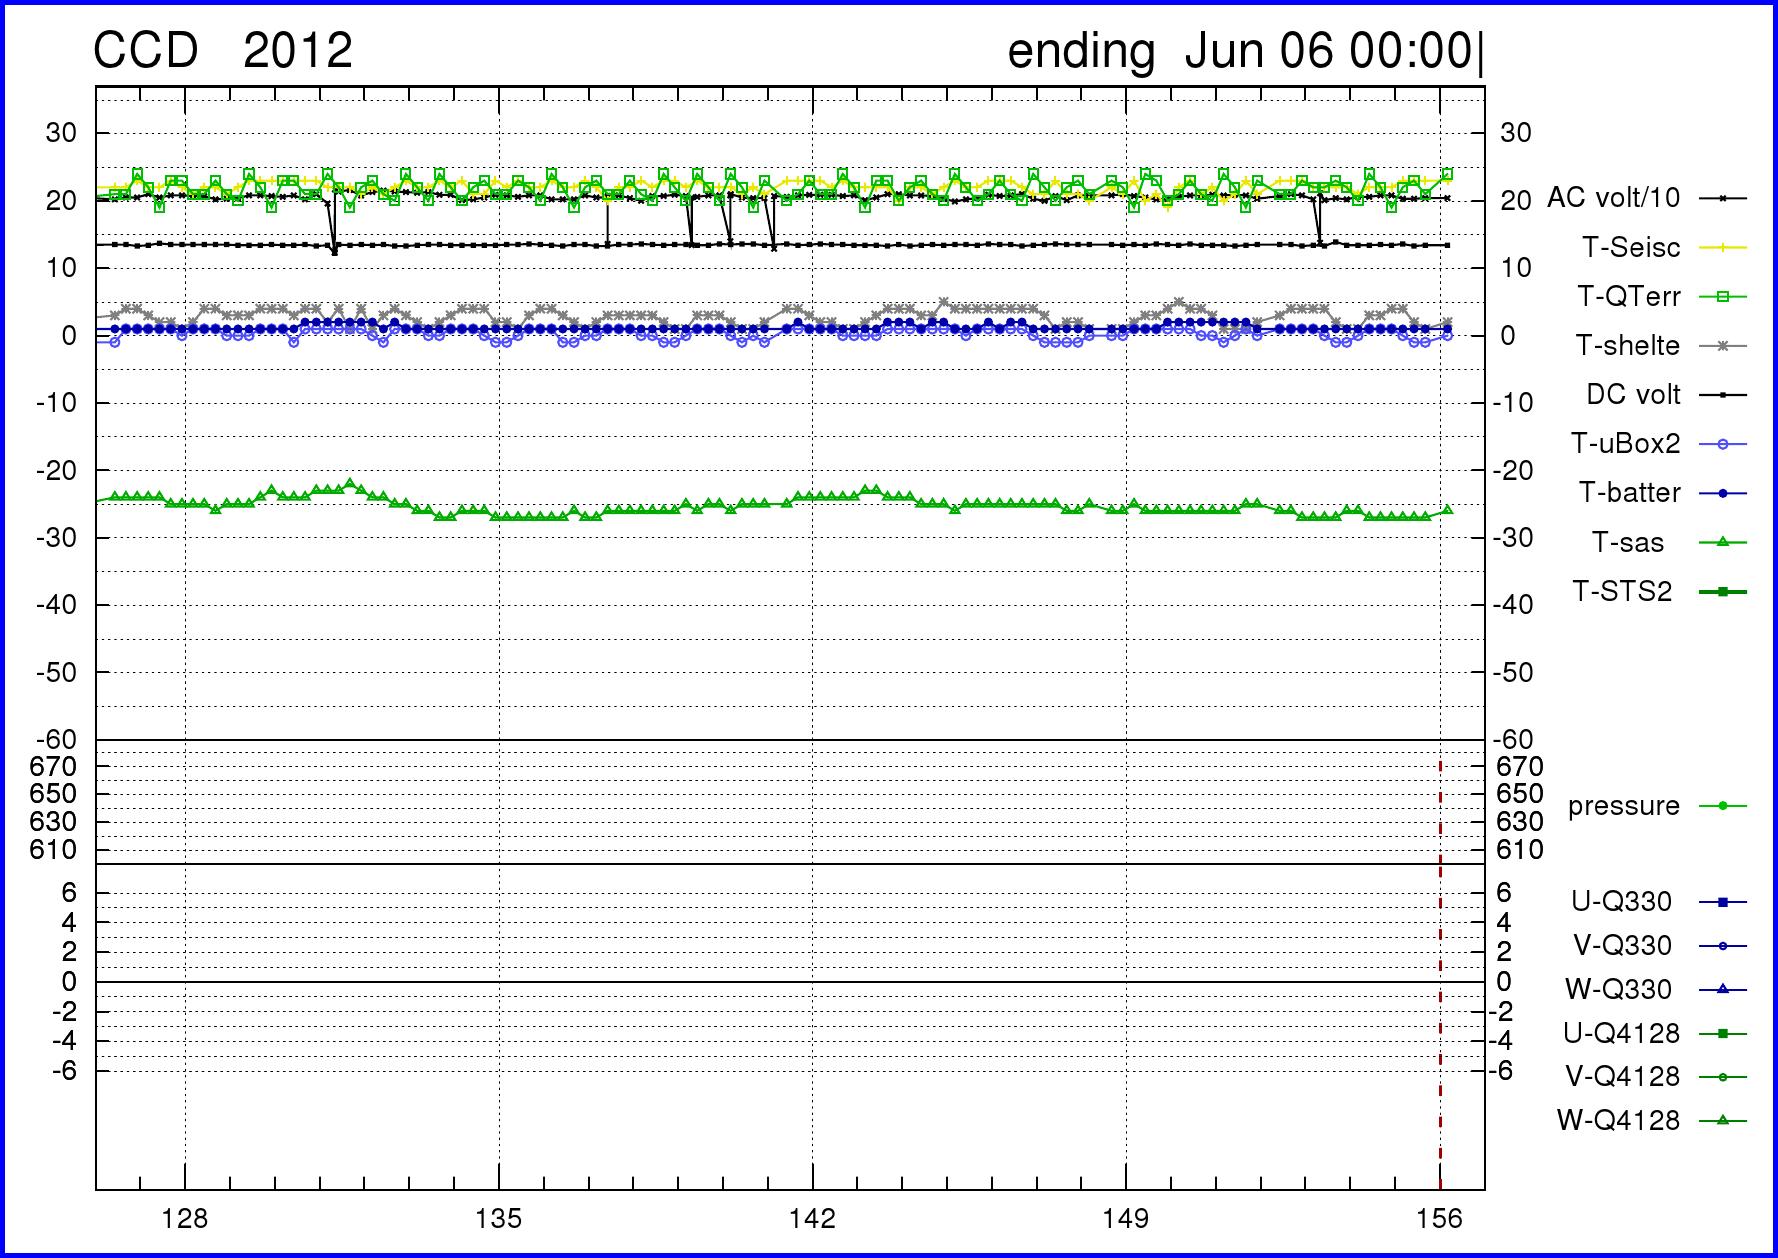
The following images, also available as pdf files for 2008, 2009, 2010, 2011 and 2012 , contain SOH information for CCD. The main parameters of interest are the mass positions LMU, LMV, LMW (in volts), the atmospheric pressure LDO (in millibars - 650 millibars), and the temperature of the seismometer (in degrees C).
Click on the images for a larger version
Daily snapshots of the CCD data from January 1st, 2008 are available
in the following pdf files:
2008.CCD.LHZ.pdf,
2008.CCD.LHN.pdf,
2008.CCD.LHE.pdf,
2009.CCD.LHZ.pdf,
2009.CCD.LHN.pdf,
2009.CCD.LHE.pdf.
2010.CCD.LHZ.pdf,
2010.CCD.LHN.pdf,
2010.CCD.LHE.pdf.
2011.CCD.LHZ.pdf,
2011.CCD.LHN.pdf,
2011.CCD.LHE.pdf.
2012.CCD.LHZ.pdf,
2012.CCD.LHN.pdf,
2012.CCD.LHE.pdf.
We populate a database of the global events with M6.3 and greater. These pdf files show the raw, one sample per second, three-component seismograms for these global events recorded at CCD: .
Power Spectral Density plots are a useful tool to evaluate the performance of a seismic station. You can find journals of daily PSD plots for the two instruments at CCD station in the following pdf files:
2008.CCD.LHZ.psd.pdf,
2008.CCD.LHN.psd.pdf,
2008.CCD.LHE.psd.pdf.
2009.CCD.LHZ.psd.pdf,
2009.CCD.LHN.psd.pdf,
2009.CCD.LHE.psd.pdf.
2010.CCD.LHZ.psd.pdf,
2010.CCD.LHN.psd.pdf,
2010.CCD.LHE.psd.pdf.
2011.CCD.LHZ.psd.pdf,
2011.CCD.LHN.psd.pdf,
2011.CCD.LHE.psd.pdf.
2012.CCD.LHZ.psd.pdf,
2012.CCD.LHN.psd.pdf,
2012.CCD.LHE.psd.pdf.